Server monitoring across every client network
Rapitt monitors Windows and Linux servers wherever they sit — behind a client's VPN, in a branch office, or on a network no tunnel reaches. Every five minutes it reads connectivity, CPU, memory, disk, services and certificates, and orders the fleet by what needs you first.
See your servers in a demoMonitor servers behind VPNs without a jump box
Every client network is its own world, with overlapping address ranges and its own VPN. Traditional server monitoring software expects one flat network, so teams end up with a monitoring server per client or an engineer connecting to tunnels one at a time.
Rapitt runs one tunnel pod per client VPN, each in its own network namespace. Overlapping subnets never collide, every site is scanned at the same time, and a tunnel that drops is brought back up on its own. The VPN page shows each tunnel's state, its uptime and the recoveries it has made.
For a server no tunnel reaches, install the server agent with one command. It runs the same snapshot as a scheduled task on Windows Server or a systemd timer on Linux and reports over HTTPS.

What each server reports
Open any host and its detail is grouped into tabs, each answering one question.
Summary
Reachability, latency, uptime, CPU and memory now and over seven days, and the last reading's time.
Drives
Every volume with free space, growth rate and the projected day it fills.
Services & IIS
Watched services, IIS sites and application pools, and database engines — with restart from the console.
Network
A network score, interfaces, traffic, listening ports with their process, and an on-demand speed test.
RCA analysis
Root-cause analysis that lines up alarms, readings and events around an incident.
Scripts
Run approved scripts through the tunnel and keep the output with the host's history.
Right-size before you buy hardware
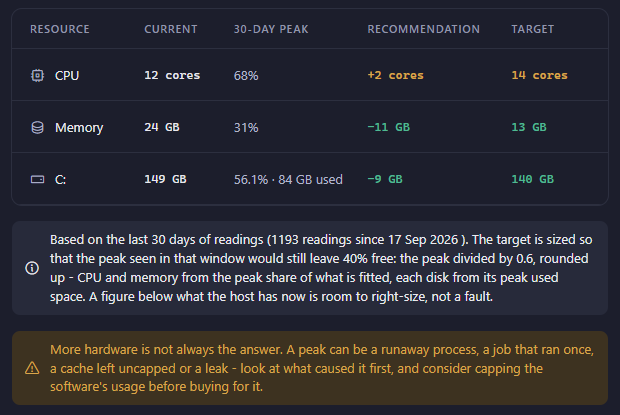
The hardware efficiency tab turns thirty days of readings into a recommendation per resource: the peak, the average, and the size that would still leave 40% free at that peak. Over-provisioned virtual machines show up as savings; under-provisioned ones show up before users notice.
It also says when more hardware is not the answer. A CPU pinned at 100% by one runaway process is a service problem, and the recommendation names the process rather than the upgrade.
The fleet overview, ordered by concern
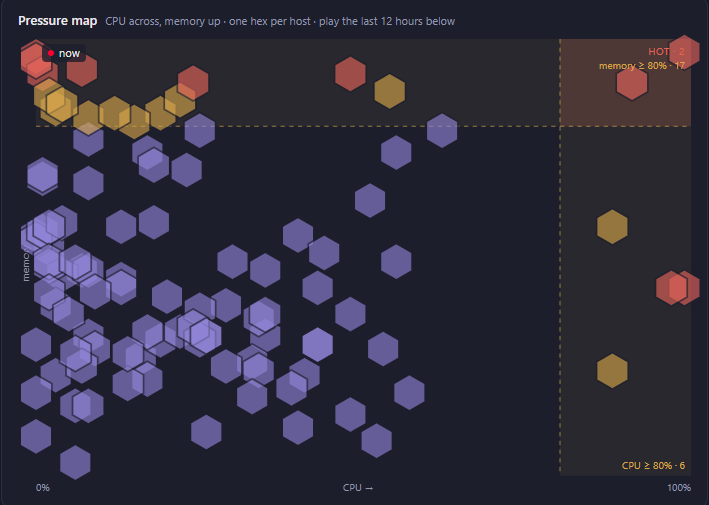
The overview opens with one sentence — for example, 86 of 101 hosts are behaving — then six categories with their thresholds: connectivity, CPU, memory, disk, certificates and security. A pressure map plots every host by CPU and memory so the hot corner is obvious, and a sunburst shows clients on the inner ring and their hosts outside, with problems reaching further out.
Maintenance is handled honestly. Pause a host or a client and the console says who paused it and when, so a quiet host is never mistaken for a healthy one.
Server monitoring questions
Which VPN types are supported?
Common site-to-site and client VPNs used by enterprise firewalls. Each is configured once per client in the console; the tunnel pod holds it from then on.
How are servers added?
Over SSH or WinRM through the tunnel, by installing the server agent, or by manual upload of a snapshot for isolated systems.
How fast is a full sweep?
Tunnels are scanned in parallel. In one production deployment, 96 hosts across 15 VPNs complete in 52 seconds, well inside the five-minute cycle.